
The aim of this activity is to practice analysing statistical data from market research (in this case, provided by finder.com).
This activity will present statistics to you in a number of different formats.
You need to look at this information and try to establish reasoning for any and all differences illustrated between genders, regions and generations.
We have included exercises in each section for consideration in your analysis.
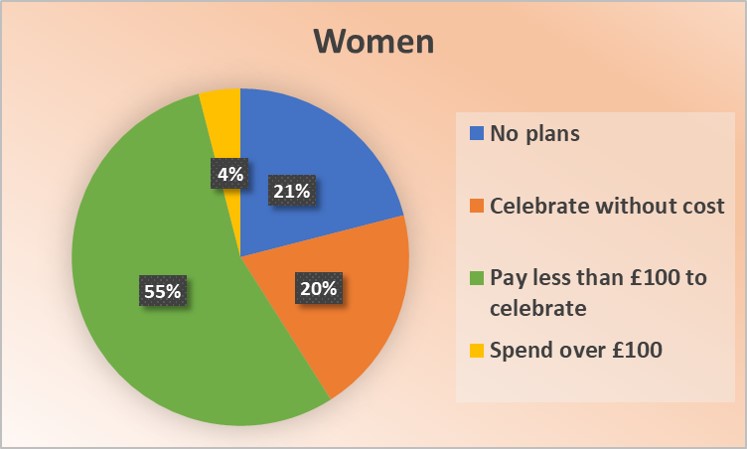
Below are charts demonstrating how many people planned to celebrate Valentine's Day and, if so, how much they would spend.
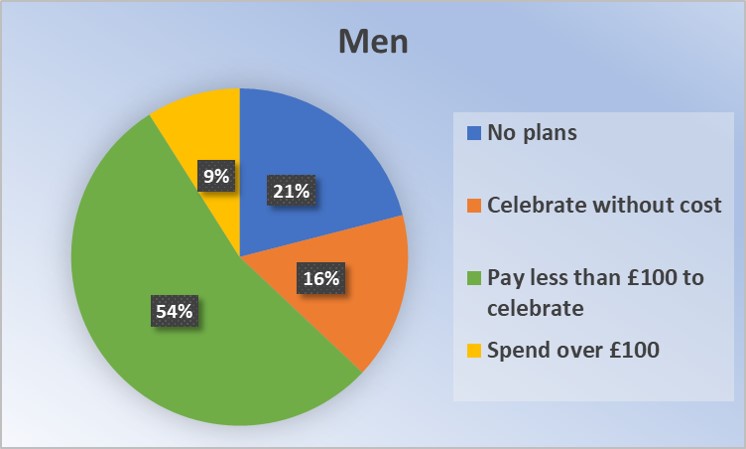
How does this information help us better understand the commercial aspect of this holiday?
Why do you think that more than double the number of men are likely to spend over £100 on gifts?
This collected data has a binary focus on men or women, how might the research have been more inclusive and a truer reflection of society and the market?
In the previous section, we saw how many people plan to celebrate Valentine's Day and spend money on gifts.
If these plans go ahead, £1.45 billion will be spent in the UK on Valentine's gifts. That is an average of £35.06 per person.
As indicated with the patterns seen in the above pie charts, men will spend more on average (£44.24) than women (£26.24).
To analyse the spending patterns in the UK more thoroughly, let us look at the regional break-down for average spending on a gift for Valentine's Day.
| Region of the United Kingdom | Average Spend on a Valentine's Gift |
|---|---|
| London | £52 |
| North-East | £37 |
| East | £36 |
| Northern Ireland | £35 |
| North-West | £35 |
| Yorkshire | £35 |
| West Midlands | £33 |
| Scotland | £32 |
| South-East | £31 |
| East Midlands | £30 |
| Wales | £29 |
| South-West | £28 |
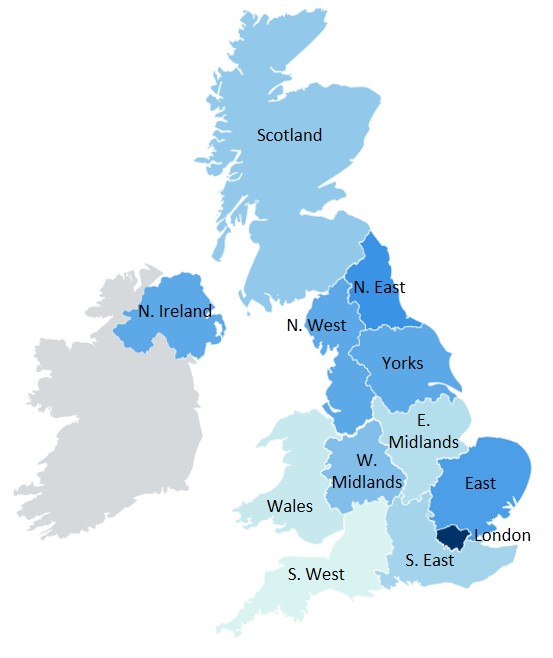
What does this mean for shops in each region?
Wales is the only region in the UK to have a national alternative to St Valentine's Day - this is St. Dwynwen's Day and it falls on the 25th January each year. Consider then, why is the lowest average spend in the South-West instead?
London considers itself as the "Romantic Capital" of the UK as a result of higher average spend every year. Consider other reasons for this higher expenditure and how these may undermine such a claim
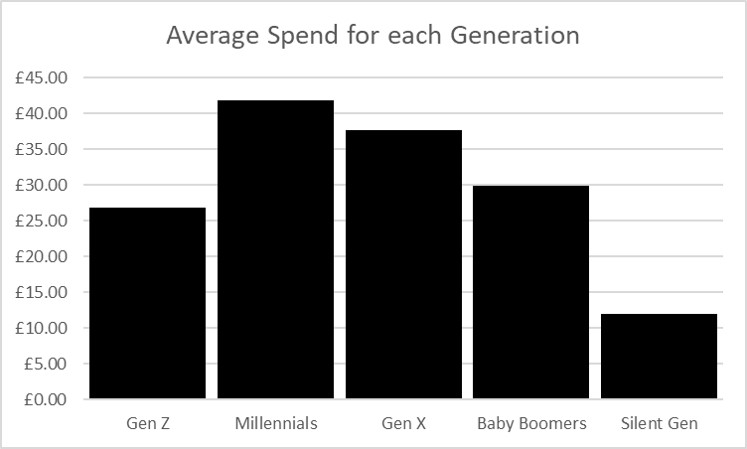
Finally, let us look at the differences in average spend on Valentine's Day gifts between the generations.
Definitions:
Here is a table of the top three age groups celebrating whilst not spending any money:
| Generation | Percentage of celebrants |
|---|---|
| Silent Generation | 30% |
| Baby Boomers | 21% |
| Millennials | 17% |
Consider the reasons behind the Silent Generation being the lowest spenders.
Why do you think Millennials are the biggest spenders?
Generation Z are the second lowest spenders. What reasons might there be for this?